Remote sensing delivers more than forage numbers |
| By Josh Pittman |
|
|
The author is a sensor system manager and scientist at the Noble Foundation in Ardmore, Okla. 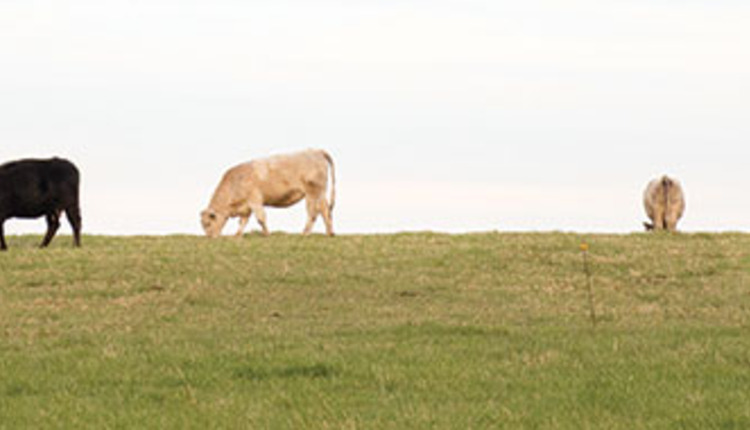 After about five years of study, we have developed a combination of technologies that the Noble Foundation currently uses as a forage biomass and crude protein estimation tool. More than numbers The system consists of a spectral instrument that measures the amount and intensities of red light and near infrared light reflected off of vegetation. The colors we see are the colors that an object reflects, so there is more green vegetation when less red light is reflected. The amount of green directly relates to the amounts of biomass and crude protein. The system also uses sonar and laser to measure the actual forage height and estimate the amount of forage present. Lasers help measure any holes in the forage canopy, and the sonar measures the average overall canopy height. Also, a global positioning system (GPS) records the location of the forage measurements. This collection of instruments is contained in a case and can be attached to any ground-based vehicle platform, like a golf cart. These pieces of equipment are measuring devices. They deliver data, not information. Many pieces of remote sensing equipment are available on the market, but their data output is often hard to translate into information for making practical decisions. Our goal was to deliver information, not just numbers. The software used to collect all the data is a key to delivering information. Software developed at the Noble Foundation called AgriLogger collects information from many sensors at one time and puts it all together in a way it can later be easily analyzed and converted into an information product. There are two ways information could be delivered. The first would be in a table format with numbers corresponding to the amount of estimated forage and estimated utilization potential in pounds of beef or head of cattle (see Table 1). Another is a visualization tool, which takes the collected data from the sensors and spreads it out graphically in map form to show the amount, quality, and location of forage (see graphic). This type of visualization tool can be used when making decisions that optimize forage production through spatial management. 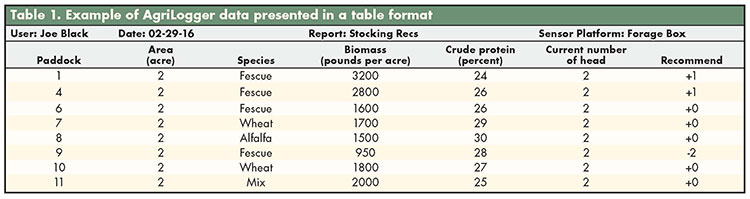 Spatial management refers to the idea that not all parts of a field are equally productive. With some help, less productive areas can become more productive while more productive areas are given less focus. This could help improve your bottom line by saving on input expenses, such as fertilizer and herbicides, by more efficiently using resources. Looking forward Everything mentioned to this point is in use in some form at the Noble Foundation today. Next, we will look at what the future of this technology in production scenarios could hold. Some dots in the agricultural technology world still need to be connected. Large-scale modeling for supporting a management knowledge base will be essential. Similar to the Facebook modeling engine that predicts ads you would be interested in based on a history pattern of your searches, over time patterns can be established when information is collected from sensors that estimate forage amount and quality. A modeling engine could also pull in other pieces of data related to climate, market, and soil variables to begin establishing more patterns. From the patterns, predictions could be made at a general precision level. As more specific data is added, such as the forage amount at a particular spot on a particular day, the predictions would get more precise for future implications. These modeled estimates could range as simple as the forage amount, where the manager makes the call on how to allocate the resource, to as complex as offering trend information on how holding or selling according to the current market, climate, forage species, and forage load could influence the bottom line for the production cycle. This leads to the next level in data to be turned into information. Unmanned aerial vehicles (UAVs) hold the potential to collect much larger amounts of data more quickly and deliver more comprehensive information. One key difference with the UAV will be the use of light detection and ranging (LIDAR) lasers to essentially draw a point-by-point picture of a management area and evaluate it as a whole or in pieces. The data collected from LIDAR is called a point cloud, which has a much greater resolution than the systems currently used at the Noble Foundation. The functional difference is somewhat similar to the difference between an old-fashioned tube TV and a new generation 1080p HD smart TV. Although both can deliver a discernible picture, the newer generation TV is much more detailed and delivers higher resolution visualized information. Delivering data as information The last component of a system is the delivery vehicle, often referred to as a dashboard or user interface. This component predicts outcomes and delivers information based on a combination of specific data unique to a certain producer; general data such as soils or weather data, and global data such as forage species. This product delivery avenue could be embodied in a smartphone app or a web page. All types of information can be collected and entered just like many online calculators or possibly seamlessly based on a user profile and automatic-upload features that capture data directly from sensors. When the user decides enough information has been entered or all the available information has been collected, regardless of how sparse or extensive it may be, the visualization and table information could be turned into a report. From these two pieces of information, a manager could visually realize how resources are oriented in an area, as well as what the quantitative numbers actually are and what possibilities or limitations the future may hold. Quantifying change It seems appropriate to draw one final comparison to put into perspective the power of leveraging this type of information. During a year of beef production, a producer will use a specific number of supplement cubes and hay bales. Most likely the producer will have done some sort of calculation to determine how much supplementation would be needed. That calculation might have been done very precisely with software, on the back of a napkin at the coffee shop or from intuition and experience, but an estimation was made. The type of technology application described here is also a tool for estimation. The difference is that forage systems, which are dynamic and change daily, could begin to be viewed as a more tangibly quantified feed source. First, we must be able to more fluidly and rapidly review the system resources and deliver information to match the ever-changing production of the system. This will continue to be a major focus for the agronomy lab so that we can continue to develop and ultimately help deliver tools that provide valuable decision-making information to producers. 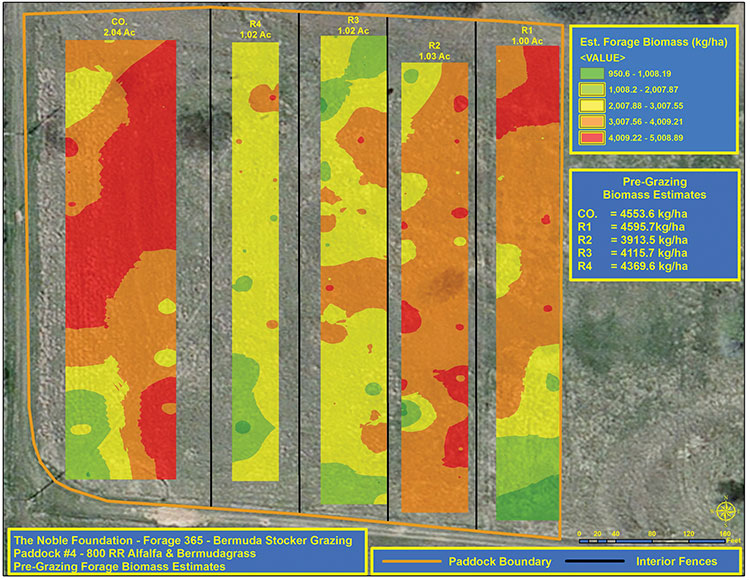 Remote sensing has the capability to provide information such as forage biomass estimates that can be used to guide daily decisions This article appeared in the August/September 2016 issue of Hay & Forage Grower on pages 18 and 19. Not a subscriber? Click to get the print magazine. |