Potassium level trends deserve watching |
| By Sally Flis |
|
|
|
The author is a former field and crop support specialist at Dairy One Soil and plant potassium (K) levels have frequently come up at meetings and in conversations with concern for declining soil K levels in the Northeast. Potassium is involved in disease resistance and cell water management in plants and animals. Legume crops, such as alfalfa, are heavy users of K with a critical level of 2.3 to 2.5 percent dry matter (DM). Additionally, maintaining K concentrations in the soil increases winter survival and nodulation in alfalfa. At the Agro-One Lab, Mehlich-3, Modified Morgan’s, and Morgan’s extractions are performed for determining nutrient levels in soils. On average over the last six years, Mehlich-3, Modified Morgan’s, and Morgan’s analyses accounted for 63.3 percent, 18.6 percent, and 18.1 percent of the analyses, respectively. During this time, the average soil test K level has been high and has remained high for all three soil test extractions. Soil K trending steady The average K over this period for Morgan’s was 213 pounds per acre, 221 pounds per acre for Modified Morgan’s, and 241 pounds per acre for Mehlich-3. There is no trend for either rising or declining soil test values. However, the standard deviation of all the extractions was almost equal to the average, indicating a very large range in sample results. Because of the range in the results, the average is not an accurate representation of what is happening in the soil testing population. In order to get a better representation of the K status of soils, the percentage of tested samples that resulted in a recommendation of a no K application for the crop was determined (Table 1). No application recommendations are based on the soil test level being above the excessive soil K concentration for each extraction method. The Mehlich-3 and Modified Morgan’s extractions had fewer samples that would result in a recommendation of no additional K needed (Table 1). 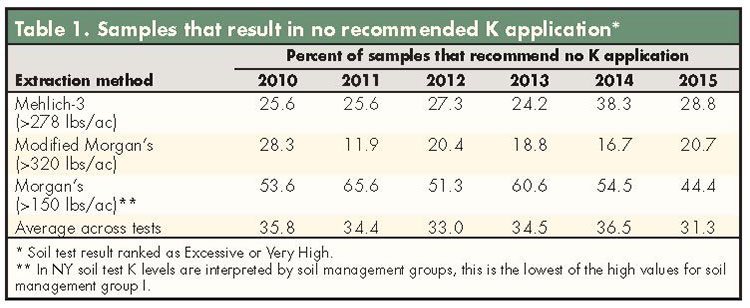 Across all soil tests, more than 60 percent of all soils tested every year would recommend some K application to maintain soil nutrient status or meet crop needs. This is a great example of where averages are not telling the whole story. Looking only at the averages, the assumption would be that we are doing well with K applications and possibly even excessively applying for Mehlich-3 and Morgan’s soil test results (Figure 1). 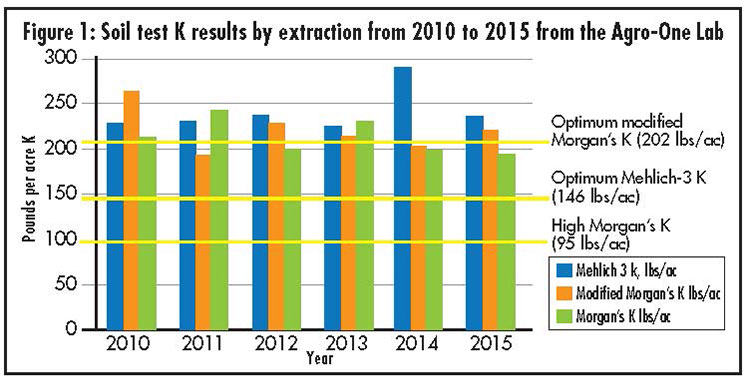 Soils testing in the Optimum range, defined as the range in which crops are unlikely to respond to K fertilizer, but where K may be applied to maintain the fertility level as optimum, were consistent across all soil extractions. During the five-year period, the soils testing in the Optimum range averaged 42.1 ± 2.9 percent for Mehlich-3, 14.4 ± 0.64 percent for Modified Morgan’s, and 28.5 ± 3.0 percent for the Morgan’s extraction. Know your manure K So, why do more than 60 percent of soils tested recommend K application to maintain soil nutrients or meet crop needs? One reason might be in the accounting for nutrients from manure sources. In the Northeast, manure accounts for a large percentage of K applications to forage crops. The average book value for liquid dairy manure is 20 pounds of K2O per 1,000 gallons. However, the average manure pounds of K2O per 1,000 gallons for samples submitted to the Dairy One Forage Lab are lower than the book value (Table 2). 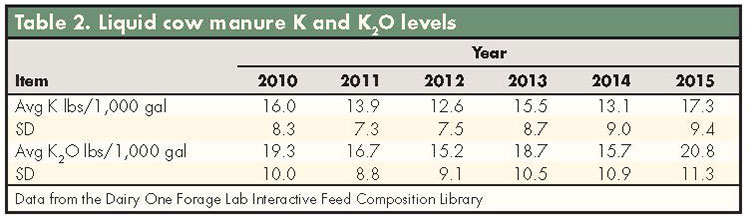 If a book value is being used for planning rather than an actual analysis value, K2O is being applied at lower rates than desired. The average shortfall of K2O in 2012 was 4.8 pounds per 1,000 gallons. For an 8,000 gallon per acre application rate, this equates to 38.4 pounds less of K2O per acre than planned. Depending on your soil test result, this could be all the K application recommended. The final piece of the equation is plant K concentration. The concentration of K (percent DM ) in forages analyzed in the Dairy One Forage Lab have remained steady over the last six years (Table 3). The legume hay concentrations of K are just at the critical level of 2.3 to 2.5 percent DM and have risen slightly over the last five years. Legume silages are above the critical level and have remained consistent, while corn silage concentrations of K are at the low end of the range for whole plant K concentration between physiological maturity and grain harvest at 1.0 to 1.2 percent DM. The forage K concentration data indicates that corn silage is the most likely to be experiencing K deficiency.  If you are suspicious of a K nutrient problem, looking into the field history, nutrient application, and adding tissue testing to your soil fertility monitoring plan will help to direct future strategies. This article appeared in the November 2016 issue of Hay & Forage Grower on pages 18 and 19. Not a subscriber? Click to get the print magazine. |