It’s true for RFQ, too |
| By Mike Rankin, Managing Editor |
|
|
|
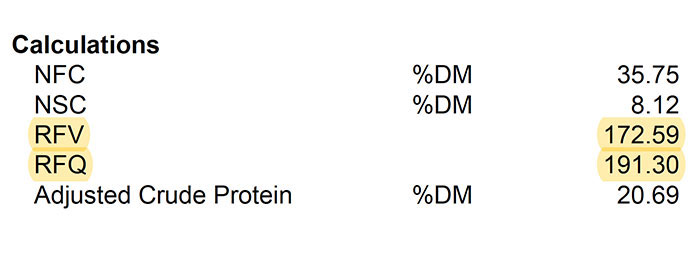
In last week’s eHay Weekly, we summarized a panel discussion that was offered at the American Forage and Grassland Council’s annual meeting. The focus was on the various equations for total digestible nutrients (TDN) and how this has led to frustrations when comparing values and inaccuracies of predicted livestock performance. Essentially, the TDN problem lies with those equations that use acid detergent fiber (ADF) to calculate TDN. Dan Undersander, emeritus extension forage specialist with the University of Wisconsin, rightfully pointed out that ADF was never meant to be used as a predicter of forage digestibility, and that ADF-derived TDN values fall short of assessing actual feeding value. The alternative to an ADF-derived TDN is a summative equation approach, whereby TDN is calculated by adding together the digestibility of nonfiber carbohydrates (NFC), crude protein (CP), fat, and neutral detergent fiber (NDF). This same thinking can also be applied when we think of the difference between relative feed value (RFV) and relative forage quality (RFQ), with the latter being derived by summation and the former derived directly from ADF and NDF. “The metric I find most useful for single-term analysis is RFQ,” said Dennis Hancock, director of the U.S. Dairy Forage Research Center in Madison, Wis., during the aforementioned panel discussion. “It’s a robust, calculated equation that includes TDN, so having an accurate TDN estimate is still important.” Like a tomcat The RFQ metric for indexing forage nutritive value has now been around for over 15 years. Though widely used, it is still common to see its predecessor, RFV, being reported at an unusually high frequency. It’s like a stray tomcat that just won’t leave the barn. Over 30 years ago, RFV totally shifted the focus of alfalfa evaluation off of crude protein and into the realm of fiber analysis. Though not a measure used for balancing rations, it provided a single-term means of indexing forage for assessing alfalfa quality. The concept was widely adopted because it was easy and defendable with the day’s evaluative knowledge. Unlike TDN, one problem with RFV is that it was developed solely for use on alfalfa. Many people tried to expand its utility to other forages such as grasses and corn silage, but doing so made these other forage types look much worse than they really were. Without delving into the equations, RFV failed to consider that not all fiber is created equal in terms of digestibility, which is a similar situation with ADF-derived TDN. Enter RFQ. Grasses get their fair due Like TDN, RFQ is not perfect, but it does offer a one-stop shop to initially evaluate the quality of a forage. Better yet, it gives grasses their fair due and considers the impacts that the growing environment (moisture and temperature) has on forage fiber digestibility. It makes sense that RFV and RFQ are highly correlated; values for both generally decline as plant maturity advances. That said, they are not the same, especially for grasses and where environmental factors come into play. During my extension career, I was involved in measuring the yield and forage quality of alfalfa fields that spanned across Wisconsin. For two of those years, 2010 and 2011, I decided to compare the RFV and RFQ values for each cutting from all of the project fields. The values for first cutting in each year are presented below. Figure 1. RFV versus RFQ for Wisconsin first cutting in 2010 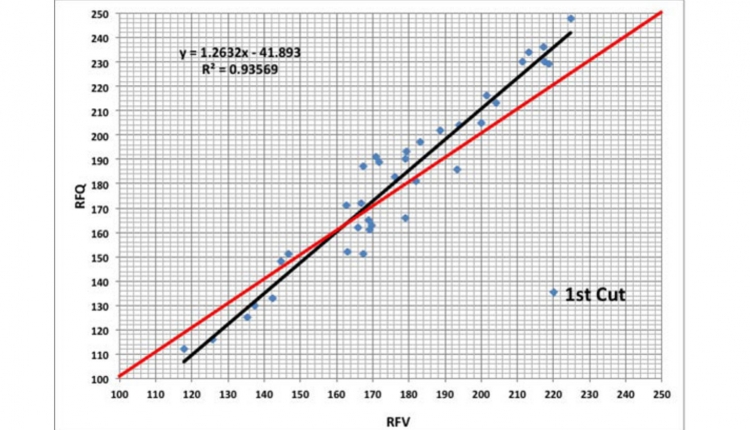 Figure 2. RFV versus RFQ for Wisconsin first cutting in 2011 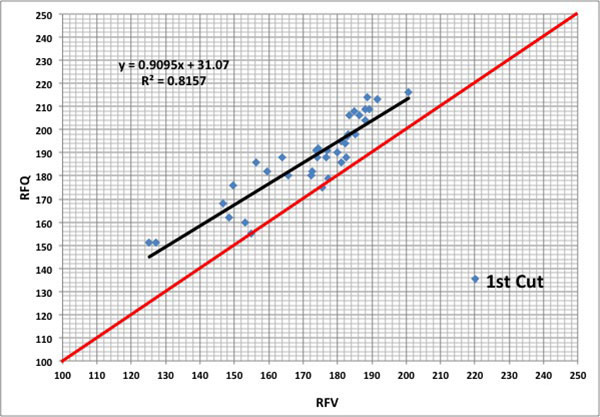 The red line in each graph depicts a one-to-one relationship. In other words, if RFV and RFQ were exactly equal, the data points would fall on the line. Rather, what I saw is that for higher quality samples (mostly those cut early), RFQ was greater than RFV (data points above the red line). This held true in both years. In 2010, as maturity advanced and forage quality declined, RFV was often higher than RFQ (data points below the red line). RFQ penalized the forage for lower fiber digestibility; RFV did not. This is what I’ve found to be the normal trend for first and subsequent cuttings. Environment matters The next year (Figure 2) told a different story, primarily because temperatures stayed relatively cool throughout the earlier than normal harvest window and RFQ remained above RFV for the entire harvest window. The lesson is that 150 RFV forage may be 150 RFQ, or it may have a RFQ value significantly higher or lower than 150. Species, maturity, and growing environment (especially temperature) will dictate actual fiber digestibility. It’s more likely that RFQ will better reflect how the forage actually “feeds.” The ramifications of the differences between RFV and RFQ are quite large for both the buyer and seller of hay. Even if cut at the same maturity, forage grown in a hot, arid environment is different than that grown in a higher elevation where night temperatures are cool. RFQ will better assess and reflect these differences. Better yet, RFQ will more accurately predict how your animals will perform and offers a more correct assessment of market value. Perhaps someday we can argue whether the best single metric for assessing hay quality is summative TDN or RFQ. But before we get there, there needs to be a strong push to put ADF-derived TDN and RFV into a museum and off forage analysis sheets and “hay for sale” ads. |