According to data that was recently released by the National Agricultural Statistics Service (NASS), there are roughly 1.8 million dairy cows in California. A typical Western lactating dairy cow diet contains about 6 to 10 pounds of alfalfa hay. Hence, California dairy cattle probably consume around 9,000 tons of hay per day, and one could speculate that there is more than $2 million in hay value consumed daily in California alone.
Determining the appropriate value on every sold ton of hay is as hot a topic as ever; however, determining the economic value of forage is difficult, especially if using the current set of USDA Alfalfa Quality Guidelines.
Grading inconsistencies on the same analysis, or between buyer and seller, may be real because different analytical results measure different characteristics of forage. For example, total digestible nutrients (TDN) and relative feed value (RFV) are often used to value hay, but these are calculated differently. Resulting inconsistencies are typically not due to bad methods, poor laboratory performance, or scientist incompetence in developing hay quality grades. Rather, inconsistencies occur because TDN is derived from acid detergent fiber (ADF) and RFV is derived from both ADF and neutral detergent fiber (NDF).
In 1998, the USDA Agricultural Marketing Service (USDA-AMS) established Hay Quality Guidelines that used ADF and RFV to determine quality designations for alfalfa and crude protein (CP) for grasses. The intent was not to determine price or acceptability, but to ensure that USDA-AMS used the same criteria for uniform reporting of prices across the nation. Yet, these grades have evolved into price determinants.
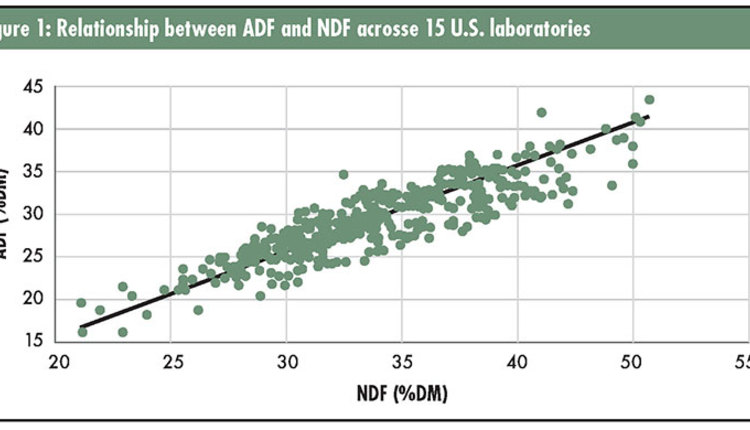
By 2002, there was impetus to review the USDA-AMS guidelines for alfalfa hay. Mertens sought to evaluate the relationships between ADF and NDF across laboratories throughout the country to determine if uniform alfalfa hay quality guidelines could be developed for the nation. About 1,200 analyses of alfalfa were obtained from laboratories in 15 states. Following a detailed statistical evaluation, an average intercept was used to derive the regression equations presented in Figure 1, developing a relationship between ADF and NDF.
ADF and NDF are different
These equations were used by the USDA-AMS for the national hay quality guidelines. Generally, the ADF and NDF values agree as verified by the high R2 value. As such, TDN and RFV are strongly related as well. Yet, there is considerable variation in the relationship between ADF and NDF, which can cause inconsistencies in TDN relative to RFV.
Some people have suggested simplifying hay evaluation by measuring only ADF, and then predicting NDF. This suggestion is often based on data from one laboratory, but, as seen in Figure 1, the variation between ADF and NDF is considerable, at times varying by 10 to 12 percentage units.
Acid detergent fiber was developed as a preparatory fiber for the measurement of lignin; it was never intended to be a measure of dietary fiber. Neutral detergent fiber was designed to separate total insoluble fiber, which is slowly digestible or indigestible, from the neutral detergent solubles that are almost completely digestible by dairy cows. Later, ADF was found to be related to digestibility, and NDF was found correlated with intake.
Although ADF and NDF are correlated, their origins indicate that it is not a perfect relationship. The spread in results around the predictive equation suggests that this variation is not random (unexplained) but most likely indicates the true differences in NDF at any value of ADF. That is why we measure both NDF and ADF. They measure different types of fiber, and each type of fiber has a distinct nutritional value.
Some perceive the difference between NDF and ADF in alfalfa to be is about 10 percentage units, but this spread pertains to old varieties and when harvested at 40% to 50% NDF. Newer data and the predictive equations indicate that with NDF values of 20, 30, 40, and 50, the predicted alfalfa ADF would be 15.8, 23.9, 31.9, and 39.9, respectively. There are biological and chemical reasons for these differences between NDF and ADF. Young plants have more pectin because it is related to cell wall elongation during growth. Neutral detergent fiber is more efficient in removing pectin, which can contaminate ADF and results in higher ADF values.
Making predictions
Nutritionists today make decisions based upon expected nutrient digestibility and intake responses. Because fiber (ADF or NDF) is slowly and incompletely digested, traditional quality equations for digestion have used ADF to predict hay digestibility:
• California (CA) TDN = 82.38 – 0.7515*ADF
• Midwest digestible DM (dDM) = 88.9 – 0.779*ADF.
The CA TDN is one of the metrics in the USDA-AMS Hay Quality Guidelines, and the Midwest dDM equation is nested within the RFV equation of the guidelines. Intake potential is equally important, thus, RFV was created to combine digestibility and intake into a single index, with these parameters predicted based upon ADF and NDF, respectively.
With ADF, NDF, CA TDN, and RFV in hand, this gives us all of the criteria used in the USDA-AMS Hay Quality Guidelines (Table 1). There are currently more advanced grading and valuation summative equations that calculate TDN more accurately, which will be discussed in a subsequent column.
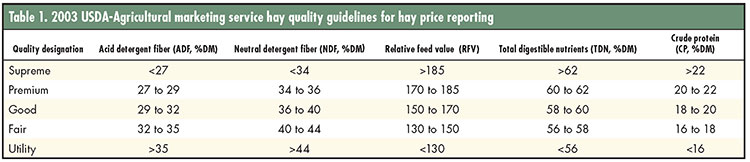
The USDA-AMS Hay Quality Guidelines (Table 1) were created to categorize hay in a concise and uniform way across the U.S. while allowing overlap between quality designations. For example, the low end of TDN for Premium equals the high end of TDN for Good. This was done to show that there is no absolute break point between quality designations. Multiple criteria also cause complications, a TDN of 63 for a hay may qualify as Supreme, but a RFV of 184 for the same hay would qualify as Premium.
Develop your own standards
Quality designations are useful for reporting prices, but they are less useful in determining prices or nutritive value. We recommend to determine an agreeable specification(s) with your buyer or seller, ideally from a single agreed upon forage testing laboratory. Use the agreed upon metric for valuation. Understand that in some cases, RFV and CA TDN will not always classify hay the same; in the same way, neither will ADF and NDF always numerically fall under the same hay grade.
Beyond ADF and NDF that determine USDA grades, there are other nutritionally meaningful data that need to be considered. For example, make sure your farm is not buying ash (soil). If one hay has 8% ash and another has 10% ash, do you want to pay $200 per ton for 400 pounds of dirt in the higher ash hay?
Also, if you’re paying alfalfa hay prices, make sure what you’re buying is pure alfalfa. If ADF is substantially less than 80% of NDF, that may indicate the hay or haylage contains some grass. Remember that the difference between NDF and ADF ranges from less than 6 percentage units for immature alfalfa to over 12 percentage for mature alfalfa. So, make sure to measure NDF and ADF at the very least.
Indexes such as RFV or RFQ can be useful in integrating multiple forage quality measures into a single value. However, understand that ADF and NDF depict all, or most, of the quality index with RFV and RFQ, respectively. Also make sure you are purchasing forage that your cows need — ones that complement the other ingredients in your rations. Late lactation cows do not have the same intake and energy needs as early to peak lactation cows. Lastly, improve your buying power and decision making by understanding that most hay quality measures are not perfectly interrelated.
While the USDA is not likely to update hay grades any time soon, you and your nutritionist can develop an alternative hay valuation approach that predicts cow performance on your farm that is different from the USDA grading scale. Today’s dairy cattle and margin fluctuations demand we identify hidden margin opportunities that USDA hay grades don’t portray.
Your nutritionist may guide you toward using newer forage quality measures, such as in vitro fiber digestion measures or summative equations for TDN that include nonfiber constituents in forages. These concepts will be further discussed in a follow up column.
This article appeared in the April/May 2020 issue of Hay & Forage Grower on pages 10 and 11.
Not a subscriber? Click to get the print magazine.